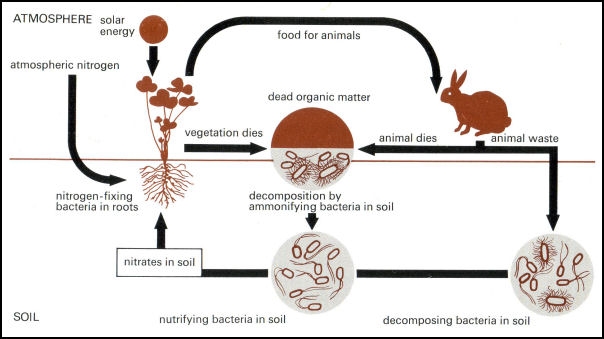
The nitrogen cycle
Conceptual Mapping
One great advantage of using computers in education is that they allow teachers and
learners to
construct logical filing systems. This means that that information is lodged within the architecture
of the knowledge system to which it is related. The construction of this kind of filing system cum
knowledge navigation system is particularly crucial to learn about industry. It meets important aims
of both teaching and learning which are to assemble a personal body of information by selecting
information from a very large multifaceted database. It can be argued that the lack of a broad-
based, user- friendly, interactive filing system has left industry on the margins of education. Within
the national curriculum, manufacturing industry can only be approached from specialised
viewpoints of institutionalised subjects, such as technology, history and economics, and not from
its all embracing position in the mainstream of human culture.
Systems Thinking
The first phase in thinking about complex dynamic systems encapsulated within the
concepts of
'culture' and 'industry' is by defining a vantage point, panoramic view, or outlook, consisting of a
map of the most important concepts and their relationships.
Using this knowledge map, a detail of current interest can be related to other information
by
navigating between the concepts which define a topic, theme, or subject. If the concepts are
arranged dynamically, i.e. they define a system which has a goal, a conceptual map on a
computer screen encourages users to quickly reach the detail they need, and to think about the
system by posing questions of the 'what happens if I do this? ' type. Computers are particularly
good for making dynamic models of systems which predict the outcomes of different courses of
action
Understanding our modern world inevitably involves unravelling dynamic, goal- orientated
systems
of one form or another. To apply systems thinking to any phenomenon a basic understanding is
obtained by first expressing some assumptions about it in the form of a map or structure summary.
This diagram summarises pathways for following through the outcomes of these assumptions.
Starting from this conceptual vantage point detailed models of a system can be compiled:-
- first, by constructing a boundary around a set of elements and interrelationships such
that the cause of the dynamics exhibited by the system resides in the boundary ('causal
models');
- second, by connecting up the elements within the boundary in such a way as to define
what is causing the dynamics to occur (closed-loop models);
- third, by identifying the limiting factors, or operational levers, which will allow the
investigator to 'run' the' system so as to make and test predictions about how it works
(operational models);
- fourth, by defining common patterns of system behaviour over time which, for example,
cause temporal phenomena, such as progressive build up, loss, and oscillation, which
are common to a variety of systems (comparative models).
Together, these four ways
of asking questions about how a system works, combined with the
panoramic conceptual map of how the system fits into a more general body of knowledge,
define 'systems thinking'.
Production model
The most common diagramatic representation of industry depicts relationships between
causes
and effects by linking components of the system diagrammatically with a one-way flow of arrows.
The aim is to show 'what causes what'. As a distinct type of educational model it may be described
as a 'causal' model because it expresses the system in terms of a one-way causality. An example
of this approach is given in Fig 1.
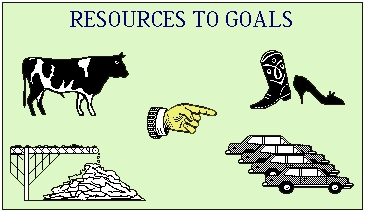
Fig 1 A causal model of industry
It summarises two distinct production systems and their goals of leather goods, and
motor cars. It
tells us that the resources to meet these goals are, respectively, biological and physical. The
pointing hand represents the 'direction', or 'management', of the flow of resources that is necessary
to produce the finished products.
To turn this one-way causal model of industry into a more realistic closed-loop systems
model
requires the delineation of feedback from sales of leather footware and motor cars to the demand
for raw materials.
To turn it into an operation model requires the identification of the main factors
which, in each case,
limits the the flow of resources. For example, two of these limiting factors are, in the long-term,
the
total population of potential consumers, and, in the short term, the amounts of money they have to
spend. It is then possible to think about what happens if the population rises or the income of
consumers falls.
The two models of the leather industry and the motor car industry can then be compared
in various
ways. For a given change in population etc will the leather industry and the motor car industry
expand or contract to the same extent?
In general the four kinds of model, 'causal', 'closed loop', 'predictive', and 'comparative'
tend to be
used in sequence as a learner's understanding increases. For example, as a simple pictorial model
of our industrial culture, Fig 1 could be developed at the primary level. In the form of a comparison
of the development of the leather and motor car industries it would be appropriate for a sixth form
geography/economics project. On the other hand, a consumer model of 'leather to shoes' or 'iron
ore to motor cars' is an alternative to the 'sweet shop' in the corner of a primary class where
youngsters first gain practical experience of economics.